

Friday, September 25, 2009
Thursday, September 24, 2009

Wednesday, September 23, 2009

Tuesday, September 22, 2009
Five Scenarios for the S&P 500
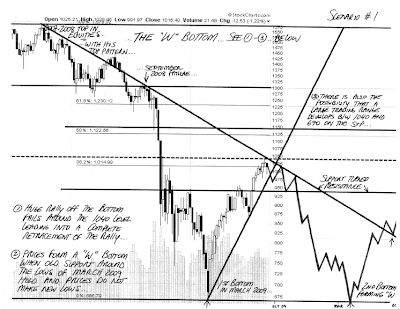
Scenario #1 - "W" Bottom
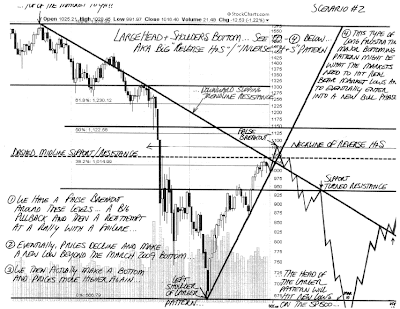
Scenario #2 - Inverse H&S
Scenario #3 - Pullback Then Sideways

Scenario #4 - Cup and Handle Advance

Scenario #5- Sustained Uptrend

Blank Template - Try Your Own Luck


Scenario #2 - Inverse H&S

Scenario #3 - Pullback Then Sideways

Scenario #4 - Cup and Handle Advance

Scenario #5- Sustained Uptrend

Blank Template - Try Your Own Luck

Saturday, September 19, 2009

Saturday, September 12, 2009


Tuesday, September 08, 2009
Annotated $SILVER

$SILVER is pushing higher today... To generate a convincing long-term BUY signal we need to see it take out the most recent highs around $21/oz...
See This Chart on Barry Ritholtz's blog, "The Big Picture"
Friday, September 04, 2009

Wednesday, August 26, 2009
Copper and Oil

See Annotated Chart on the Big Picture
That’s the dilemma… is the lag an opportunity for oil to make up ground to eventually mirror the copper move or is the fact that its so far behind indicative of its relative weakness vis a vis copper and its own innate weakness here… it is funny to talk about oil, having gone from 35 to 75, as being innately weak, but then again the S&P just went from 670 to 1030 and you can argue that its innately weak here itself…
Sunday, August 23, 2009

Wednesday, August 19, 2009
$SPXA200 - S&P 500 Stocks Over 200 Day MA

See this Annotated Chart on the Big Picture
This chart is interesting because it can be used to support many theories...
My own personal theory as to what will happen, can be seen by using this chart with the chart attached below... The thesis is that just like the % of S&P 500 stocks over 200 day ma led the SP 500 itself down in July 2007, it seems that the % of S&P 500 stocks over 200 day ma, could be leading them higher here. IAs you can see the S&P 500 itself is still fairly low on the chart, while the % of S&P 500 stocks over 200 day ma is already at 457, meaning there isn't much further it can go to the upside.
That means this chart could be used to support the following thesis:
The market continues to go higher and eventually fills the "Lehman gap" up to the high 1100's, low 1200's, but that has to be on weakening overall strength and breadth because the market has shot up so insanely already and like I said 457 of 500 are already above their 200 day ma's. That area is also the neckline that was penetrated long ago and is severe resistance. By that time, the overall rally will be some 85% off the lows and almost everyone will be sure that this is a new bull market. Picture the atmosphere now, but up another 200 points on the S&P. Those 200 points will be the public finally coming back on board as the message that recovery is here gets filtered into everyone's psyche. As you have noted, the professionals are "all in". As we move up, the public investor gets in just in time for the market to begin moving lower again in earnest...
Its just a theory, but....

Monday, August 03, 2009

Saturday, July 18, 2009
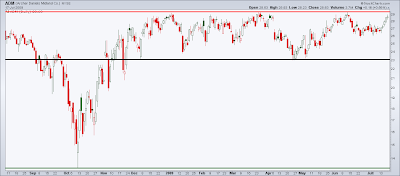
Compare ADM and the DJIA
I had a thought. Look at the chart for Archer Daniels. Big pop in October, which was when that sector of the market "bottomed", and prolonged sideways move in a range...
Then look at the chart of DJIA. Same big pop, but this time in March, followed by sideways range bound move.
THESIS:
If the DJIA follows the same pattern that ADM has, then DJIA will continue to trade sideways for a rather long time with many false break outs and break downs - similar to the ones we just endured.
ADM
DJIA

Then look at the chart of DJIA. Same big pop, but this time in March, followed by sideways range bound move.
THESIS:
If the DJIA follows the same pattern that ADM has, then DJIA will continue to trade sideways for a rather long time with many false break outs and break downs - similar to the ones we just endured.
ADM

DJIA

Sunday, July 12, 2009
Appendix to The Bubble of American Supremacy
I recommend the Appendix of George Soros's The Bubble of American Supremacy. It lays out Soros's "Conceptual Framework" including his ideas on Reflexivity, Radical Fallibility, Open Society, the Human Uncertainty Principle and The Alchemy of Finance


After reading this portion of the book I realized that the error of the various actors leading up to the financial crisis wasn't that they didn't see it coming, it was that they failed to realize that their views were subject to error and therefore, might not have been the right way to proceed. It was an example of various groups being too sure about their various world views - whether it be real estate prices always rising, the panacea of securitization or the market fundamentalism that left derivatives, etc., unregulated.
The Bubble of American Supremacy
George Soros
Public Affairs, New York 2004
See pages 191-203
Saturday, July 11, 2009
Ten Heresies of Finance
I have had the pleasure of reading the (Mis)behvior of Markets, by Benoit Mandelbrot and Richard L. Hudson recently.

Here are the "Ten Heresies of Finance"
Source:
Chapter XII: "Ten Heresies of Finance"
Pages 225-252
The (Mis)Behavior of Markets
A Fractal View of Risk, Ruin, and Reward
Basic Books, New York 2004.

Here are the "Ten Heresies of Finance"
1. Markets Are Turbulent
2. Markets Are Very, Very Risky - More Risky Than the Standard Theories Imagine
3. Market "Timing" Matters Greatly. Big Gains and Losses Concentrate into Small Packages of Time
4. Prices Often Leap, Not Glide. That Adds to the Risk
5. In Markets, Time is Flexible
6. Markets in All Places and Ages Work Alike
7. Markets Are Inherently Uncertain, and Bubbles Are Inevitable
8. Markets Are Deceptive
9. Forecasting Prices May Be Perilous, but You Can Estimate the Odds of Future Volatility
10. In Financial Markets, the Idea of "Value", Has Limited Value
Source:
Chapter XII: "Ten Heresies of Finance"
Pages 225-252
The (Mis)Behavior of Markets
A Fractal View of Risk, Ruin, and Reward
Basic Books, New York 2004.
Sunday, July 05, 2009


Tuesday, June 23, 2009

Tuesday, June 16, 2009


Wednesday, June 10, 2009

Subscribe to:
Posts (Atom)