

Saturday, October 10, 2009


Thursday, October 08, 2009
Annotated Platinum

This is my comment to the post of this chart at the Big Picture...
With respect to Gold, it is probably outperforming the rest because it is least tied to actual economic activity. I’m thinking that Aluminum and Platinum are lagging the rest because of their connection to the Auto industry. Copper is doing relatively well with the massive China buying and hopes for an economic recovery on the horizon. Silver is doing fairly well though not as well as Gold. I’m thinking that it is due to its hybrid quality of precious metal (inflation hedge) and industrial metal…
I do these charts as a way to get people to discuss the issues, and to hear what the readers are thinking, not to enforce my view on them. I never felt the need to do this before but I should mention that I have no investment positions in any of these metals, futures tied to these metals, or in any stocks in the metals space.
If I were to glean anything from this chart re: actual trading advice, the dashed line around $1359, has been acting as a key support and resistance level throughout the timeframe depicted in this chart. Therefore, if it breaks out above that level, I would buy it on a retest of the breakout as it pulls back to what would then be support around the 1360 area. This way good stops could be put in position to litigate your downside risk.
Wednesday, October 07, 2009

The Guy Bagging My Groceries Just Told Me That Gold Broke Out To New Highs and That The Dollar is Finished
I have to admit that on the Daily charts, GOLD looks extremely likely to continue higher.
On the long term charts, it is in a strong sustained uptrend.
The sentiment situation seems out of whack and skewed to the upside.
The good thing is that you can be long with a defined stop loss somewhere around the $1000 level.
Sentiment Alerts:
Last night on CNN they told me that the dollar was finished and that GOLD was at new highs.
Today on Bloomberg, literally everyone and their mother was quoted as calling for GOLD higher.
Short Term GOLD

Long Term GOLD

Long Term Goldcorp

On the long term charts, it is in a strong sustained uptrend.
The sentiment situation seems out of whack and skewed to the upside.
The good thing is that you can be long with a defined stop loss somewhere around the $1000 level.
Sentiment Alerts:
Last night on CNN they told me that the dollar was finished and that GOLD was at new highs.
Today on Bloomberg, literally everyone and their mother was quoted as calling for GOLD higher.
Short Term GOLD

Long Term GOLD

Long Term Goldcorp

Saturday, October 03, 2009

Friday, October 02, 2009

Tuesday, September 29, 2009

Monday, September 28, 2009


Friday, September 25, 2009
Speculation As a Fine Art and Thoughts on Life
Click the Link below for an explanation regarding this interesting book:

Speculation as a Fine Art and Thoughts on Life
Dickson G. Watts
Click Here For Full PDF

Speculation as a Fine Art and Thoughts on Life
Dickson G. Watts
Click Here For Full PDF

Thursday, September 24, 2009

Wednesday, September 23, 2009

Tuesday, September 22, 2009
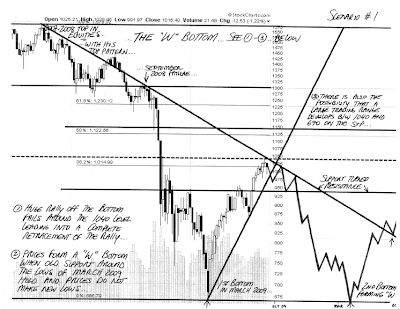
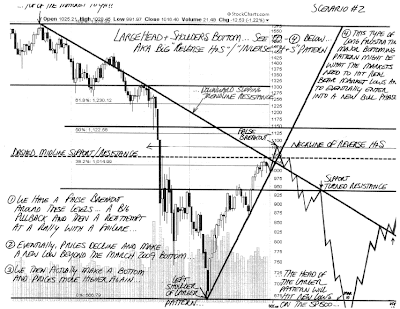
Five Scenarios for the S&P 500
Scenario #1 - "W" Bottom
Scenario #2 - Inverse H&S
Scenario #3 - Pullback Then Sideways

Scenario #4 - Cup and Handle Advance

Scenario #5- Sustained Uptrend

Blank Template - Try Your Own Luck


Scenario #2 - Inverse H&S

Scenario #3 - Pullback Then Sideways

Scenario #4 - Cup and Handle Advance

Scenario #5- Sustained Uptrend

Blank Template - Try Your Own Luck

Saturday, September 19, 2009

Saturday, September 12, 2009


Tuesday, September 08, 2009
Annotated $SILVER

$SILVER is pushing higher today... To generate a convincing long-term BUY signal we need to see it take out the most recent highs around $21/oz...
See This Chart on Barry Ritholtz's blog, "The Big Picture"
Friday, September 04, 2009

Wednesday, August 26, 2009
Copper and Oil

See Annotated Chart on the Big Picture
That’s the dilemma… is the lag an opportunity for oil to make up ground to eventually mirror the copper move or is the fact that its so far behind indicative of its relative weakness vis a vis copper and its own innate weakness here… it is funny to talk about oil, having gone from 35 to 75, as being innately weak, but then again the S&P just went from 670 to 1030 and you can argue that its innately weak here itself…
Sunday, August 23, 2009

Wednesday, August 19, 2009
$SPXA200 - S&P 500 Stocks Over 200 Day MA

See this Annotated Chart on the Big Picture
This chart is interesting because it can be used to support many theories...
My own personal theory as to what will happen, can be seen by using this chart with the chart attached below... The thesis is that just like the % of S&P 500 stocks over 200 day ma led the SP 500 itself down in July 2007, it seems that the % of S&P 500 stocks over 200 day ma, could be leading them higher here. IAs you can see the S&P 500 itself is still fairly low on the chart, while the % of S&P 500 stocks over 200 day ma is already at 457, meaning there isn't much further it can go to the upside.
That means this chart could be used to support the following thesis:
The market continues to go higher and eventually fills the "Lehman gap" up to the high 1100's, low 1200's, but that has to be on weakening overall strength and breadth because the market has shot up so insanely already and like I said 457 of 500 are already above their 200 day ma's. That area is also the neckline that was penetrated long ago and is severe resistance. By that time, the overall rally will be some 85% off the lows and almost everyone will be sure that this is a new bull market. Picture the atmosphere now, but up another 200 points on the S&P. Those 200 points will be the public finally coming back on board as the message that recovery is here gets filtered into everyone's psyche. As you have noted, the professionals are "all in". As we move up, the public investor gets in just in time for the market to begin moving lower again in earnest...
Its just a theory, but....

Monday, August 03, 2009

Subscribe to:
Posts (Atom)