Saturday, March 08, 2008

A Quick Look At Energy

NAT GAS

$NATGAS, (Natural Gas) came tumbling down from it's spike high during and after Hurricane Katrina in AUG 05. Since then it had been building a base for about two (2) years and has just kissed overhead resistance at the DOUBLE DASHED MID-LINE. Although we could see a pull back in the intermediate term we would of cause be buyers on a break out above that resistance...

CRUDE OIL

$WTIC, (West Texas intermediate Crude) finally broke above the $98 level after three attempts at doing so. At this juncture, that former resistance level must be eyed as firm NEAR-TERM SUPPORT with all of this Recession buzz, we still can't get this thing to move lower...

GASOLINE

$GASO, (Gasoline) recently broke above its previous high although its consolidation pattern doesn't appear to be as tight as that of CRUDE. However, the previous resistance levels must now be respected as good NEAR TERM SUPPORT

Thursday, March 06, 2008

Metals Miscellany

GOLD

$GOLD, (Spot Gold) broke out of a lengthy SYMMETRICAL TRIANGLE CONSOLIDATION, and has since moved up $250, touching the $1000 level but failing to eclipse that round number. It wouldn't surprise me to see an short-intermediate term pullback maybe even back to the breakout levels around $775. However, in a ripping uptrend on a long term basis.

LONG-TERM SILVER

$SILVER, (Spot Silver) made the massive move up from the $4 range until it finally broke out over the $15.20 level. After eclipsing that mark it has since moved up to a high of around $21. Similar scenario to $GOLD; I can see it really pulling back to shake out the "weak longs" only to move much higher in the Long Term.

DOW:PLATINUM

$INDU:$PLAT, (Dow/ Spot Platinum Ratio) is probably the craziest chart ever. This ratio has dropped from the 30's all the way to 5 in the past decade. Recently, $PLAT (Platinum) has spiked and this ratio had literally plummeted as the major indices are pulling back as well. Finally we had a big pullback in Platinum on Friday.

Friday, February 29, 2008

SNE - Sony Corp.

DAILY

Sony Corp. (SNE), traded in somewhat of a range on the DAILY chart before popping higher to the 55-57 level in December. after failing to eclipse that level, the stock decline precipitously below previous support to 43. Has enjoyed a recent jump which I associate with the fact that Blue Ray has defeated Toshiba's HD/DVD format. That being said, it 's unclear whether the recent rally will be more than a counter-trend retracement to the dashed mid-line of the previous decline.

MONTHLY

Tuesday, February 12, 2008

$PLAT - Platinum Futures

***PLATINUM UPDATE***

On January 26th, I posted about $PLAT, the Platinum Futures... In particular, the WEEKLY chart showed a clear cup and handle consolidation pattern that had broken out to the upside violently. It turns out there was a strike in the South African mines. However, in the past couple of weeks we have seen a massive jump in the price here. The RED horizontal line represents the old highs and the DARK BLUE CIRCLE captures the recent jump...As far as shorting it, I wouldn't get in the way, just keep an eye on it...

Monday, February 11, 2008

MSFT - Microsoft

DAILY

MSFT, is down horribly from it's relatively large pop in early November when they blew out the quarter...They are trading back down at the low end of the range on the DAILY chart as indicated by the Green Support Line...Judging solely by the distance below the SINGER EMA Band, MSFT looks like it should be due for a near term rebound to the area around the dashed mid-line/ Blue Trend-line which is now Support turned Resistance. It's unclear however, how the proposed bid for Yahoo! will turn out, and the effect that will have on the share price...

WEEKLY

MSFT, fell off badly since completing a big run from the low $20's to the upper $30's level... Retraced back to the Dashed Mid-Line which looks like a Resistance turned Support level. Big increase in Volume here as price crashed through Blue Trend-line Support, so It looks as if we could get a near term bounce back here...

MONTHLY

MSFT ran up huge into the Tech Bubble Crash and spent the better part of the next years moving sideways continuously finding Support around the $17.50 level. The SINGER EMA Band began tilting upward as price recovered above the band and moved swiftly to the high $30's recently. However, given the market turmoil as of 2008 and the proposed bid for Yahoo!, we have seen a disappointing pull back to the high $20's. The price is still supported by an upward moving EMA band but we need a move back up soon to save this one long term...

Sunday, February 10, 2008

HSY - The Hershey Company

DAILY

HSY, has been entrenched in a slow and steady down turn on the DAILY chart... The share price is exhibiting two main characteristics here: (1) There have been a number of attempt to put in a bottom, but to this date, all have failed; (2) The price has been capped by the SINGER EMA Band, which represents a significant amount of overhead supply coming into the market as sellers have taken control...One more try at a bottom here...

WEEKLY

HSY is trying to find some Support at these levels after a large decline. It looked like HSY was setting up for a symmetrical triangle continuation pattern and could really move higher except the overall market tanked and margins shrank at the venerable chocolate maker on higher input prices for COCOA and SUGAR. Broke under Dashed mid-line Support and has been trapped under the SINGER EMA Band in it's recent serious down turn as illustrated by Blue Trend-line Resistance...

MONTHLY

HSY was up massively on the MONTHLY chart from around $10 to around $65 over a 10+ year period starting in 1995.. Price took a needed rest and began consolidating those gains and looked like it might continue the uptrend. However, a decline began taking the stock down to the Resistance turned Support line formed by the 1998 highs... Significantly below a narrow downward tilting SINGER EMA Band which I think might produce a near term counter trend rally but the long term prospects are questionable...

HSY:$SPX

HSY:$SPX - really illustrates the highly oversold nature of HSY as well as it's current underperformance... Near term Bounce???

Thursday, February 07, 2008

GOOG - Google with MSFT - YHOO - $NDX


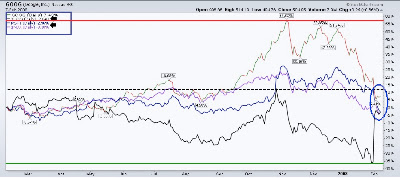
That's right ladies and gentlemen, as pointed out to me by the "popular financial blog icon" BARRY RITHOLTZ, CEO and Director of Equity Research for FUSION IQ and humble scribe of THE BIG PICTURE blog: Over the past twelve (12) months once high flyer GOOG, traditional sideways trader MSFT, woefully underperforming until recently YHOO, and Large Cap Tech Index $NDX, are all trading basically even...

Three Thoughts:

(1) BUY and HOLD is dead a.k.a it’s often a flawed strategy and it appears that this is one of those moments in time where that’s true. Basically, we’ve been “range bound” ever since the 2000 highs. If you look at the super long tem charts, there is no guarantee, and it appears unlikely that you’ll have the types of run ups in equity prices that you did over the past fifty (50) years, or more specifically from the early 1980’s to the Tech Meltdown. Not to mention, even if you do get massive “nominal run-ups because of the heavy money creation etc., your still behind the eight ball in real terms / purchasing power terms… Therefore, TRADE!!! In some environments if you refuse to go SHORT your profits will never be LONG…Also use options strategies to get returns where BUY and HOLD are not working.

(2) Indexing is now officially caught on with Index Funds/ ETFs. The question becomes why buy individual stocks if often times sectors and groups trade in unison. Relating back to the BUY and HOLD issue, people sometimes equate the purchasing of Index Funds or ETFs with a strategy that’s akin to BUY and HOLD. What intrigues me is the strategy that uses these tools as simplified vehicles to use for *market timing* type trading strategies.

(3) MEAN REVERSION is REAL…Although often times you get blown out because “markets stay irrational longer than you can stay liquid”…Which is why if you see a good opportunity on the horizon, get in small at first and then when the reversion clearly gets underway add more heavily to the thesis, or, use some sort of options strategy to stay market neutral until things turn your way and the MEAN REVERSION begins.

*Of course, there is the philosophical debate as to whether you can “time the market”; I simply refer to the fact that it has been and is done all the time as proof that it is possible…Even fundamental value investing has aspects of timing a.k.a picking the right time to BUY something and then eventually SELL it for a profit. Technical analysis/trading has a MACRO perspective as well which relates to several fundamental factors...

Sunday, January 27, 2008

YRCW - Yellow Roadway

SHORT TERM

YRCW, finally found a BOTTOM at least on a short term basis beginning in 2008. On the SHORT TERM CHART faced resistance around $15, broke out, and then rode SUPPORT TURNED RESISTANCE along $15 before spiking to the $19 level where it has met with some selling. That being said, the TRUCKING sector has gotten some recent UPGRADES and it is impressive that YRCW has been gaining steadily. I guess some kind of pullback is in order and I'd keep an eye on a breakout over $19...

DAILY

YRCW, has declined precipitously including a drop from $38 in July 2007 to a low around $12 within the past month. At this point the BLACK DOUBLE DASHED MID-LINE is acting as a RESISTANCE ZONE. In addition, BLUE TREND-LINE RESISTANCE is providing a concomitant ceiling to prices which are now above a SINGER EMA BAND that has started to rise. Any eventual breakout over this $20-$22 range will signal a more lasting turn upwards, though I can't help but think we are a little overdone to the upside near term...

WEEKLY

When your stock price declines from $65 to $12 over a three year period, there is not much good that can be said. On the WEEKLY chart, YRCW has been declining in a descending channel that has been broadening as it heads lower. After hitting $12 recently, we have seen a huge spike on high volume that has brought the price from DECLINING GREEN TREND-LINE SUPPORT back up to BLACK DASHED MID-LINE RESISTANCE. Simultaneously, the price has mean reverted to the lower average in the SINGER EMA BAND. That means heavy resistance at these levels but also signals that sentiment has finally turned and that we should look for a formation of a base...

MONTHLY

YRCW was once a stock market darling rising steadily from $10 to $65 by mid- 2005. However, it then lost all of those gains over the past three (3) years time, falling through the bottom of what looked to be TRIANGLE CONSOLIDATION. As a result, a grossly oversold condition arose, as can be seen with the recent massive bounce which left a large HAMMER BOTTOM on the MONTHLY candlestick chart. Judging by the position of the SINGER EMA BAND this rebound looks like it could get up the the low $30's after a near term pull back...

Saturday, January 26, 2008

$PLAT- Platinum Futures

DAILY

$PLAT, on the DAILY chart is shown breaking out of the CUP AND HANDLE seen on the WEEKLY chart and has been in a clean uptrend for the last four (4) months and has ridden BLUE TREND-LINE SUPPORT higher. That being said the massive increase over the last couple of trading days is strange and feels like too much- then again it could be auguring higher prices.

WEEKLY

$PLAT, engaged in a near parabolic rise from $500 to $1350 and then entered into a clear 15 month CUP AND HANDLE CONSOLIDATION. Finally, in October, the price of Platinum broke out from the HANDLE above resistance at $1350, and moved significantly higher. You would think we would get a huge rally here, but it could also be some kind of top.

MONTHLY

$PLAT rose nicely during the beginning of the millenium until it ran into stiff resistance around the $500 level through which it could not penetrate despite a number of attempts. After a quick steep correction the current massive UPTREND got going and has quite consistently without failure managed to remain above the BLUE SUPPORT TREND-LINE. As can be seen from the chart, the price of Platinum found very strong support from the SINGER EMA BAND, though it had been struggling until recently to breakout through the highs of 2006/7 represented on the chart as RED HORIZONTAL RESISTANCE.

However, recently, $PLAT has broken out strongly over those levels and has made a huge run over the past couple of months ever since the August lows in the equity markets and the attendant extra liquidity being infused.