WEEKLY
Looks like DRI has support around 34, and secondarily around $28.50...
MONTHLY
DRI has been riding support trend line all the way up from 5 to 45 over the past decade...Looks dangerously close to crashing through resistance as it is clearly losing momentum...
***UPDATE*** DRI CRASHES
Wednesday, December 19, 2007
Monday, December 17, 2007
$VIX - Volatility Index
Monday, December 10, 2007
Saturday, December 08, 2007
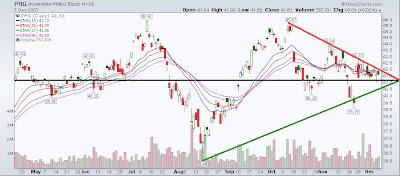
PHG - Philips
MONTHLY (1)
MONTHLY (2)
WEEKLY
DAILY
30 MINUTE
REFERENCES:
PHG buys GENLYTE
TWO RECENT UPGRADES FOR PHG
SOURCES:
http://finance.yahoo.com/q?s=phg
http://www.philips.com
http://www.stockcharts.com
MONTHLY (2)
WEEKLY
DAILY
30 MINUTE
REFERENCES:
PHG buys GENLYTE
TWO RECENT UPGRADES FOR PHG
SOURCES:
http://finance.yahoo.com/q?s=phg
http://www.philips.com
http://www.stockcharts.com
Thursday, December 06, 2007
$USD - US Dollar Index - Daily
The US DOLLAR finally stopped going down...At least for now we are experiencing a bounce which should take us back to SUPPORT TURNED RESISTENCE at the green trend line...Other Central Banks, namely England and Canada, have lowered rates recently thus dampening the relative unattractiveness of the USD.
$WTIC - Crude Oil
CRUDE OIL made a near term double top on the DAILY chart recently after failing at the $100 level...Morbidly overbought but has pulled back nicely to first support level...Can't help but think the recent news out of the NIE has helped ease the IRAN PREMIUM...
MONTHLY
CRUDE OIL on a long term basis is still firmly in an UPTREND could pull back to the midline here a still be well wihin itself...
$GOLD - Spot Gold - Weekly
Wednesday, December 05, 2007
Bruce Kovner on Technical Analysis
INSIGHTFUL QUOTES on Technical Analysis by BRUCE KOVNER of CAXTON ASSOCIATES...
Q: Is the generalization of that example that when an important fundamental development occurs, the initial direction of the market move is often a good tip off of the longer term trend?
A: Exactly. The market usually leads because there are people who know more than you do. For example, the Soviet union is a very good trader.
Q: In which markets?
A: In currencies, and in grains to some degree.
My point is that there are thousands of difficult to understand mechanisms that lead the market, which come into play before the news reaches some poor trader sitting at his desk. But one thing that does hit the market is a huge sale or purchase.
Technical analysis, I think has a great deal that is right and a great deal that is mumbo jumbo.
There is a great deal of hype attached to technical analysis by some technicians who claim that it does predict the future. Technical analysis tracks the past, it does not predict the future. You have to use your own intelligence to draw conclusions about what the past activity of some traders may say about the future activity of other traders.
For me technical analysis is like a thermometer.
Fundamentalists who say they are not going to pay any attention to the charts are like a doctor who says he’s not going to take a patient’s temperature. But of course that would be sheer folly. If you are a responsible participant in the market, you always want to know where the market is- whether it is hot and excitable, or cold and stagnant. You want to know everything you can about the market to give you an edge.
Technical analysis reflects the vote of the entire marketplace and, therefore, does pick up unusual behavior. By definition, anything that creates a new chart pattern is something unusual. It is very important for me to study the details of price action to see if I can observe something about how everyone is voting.
Studying the charts is absolutely crucial and alerts me to potential disequilibria and potential changes
Source:
Jack Schwager, Market Wizards, pp. 61-63
Subscribe to:
Posts (Atom)