

Saturday, November 29, 2008
Sunday, November 23, 2008


Thursday, November 13, 2008

Rectangle Continuation Pattern
Bearish Rectangle Continuation Pattern
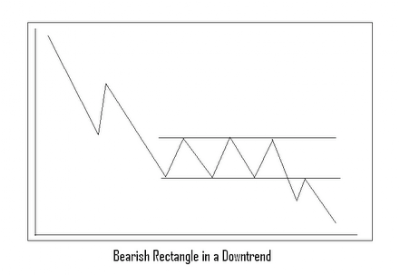

Of course, Technical Analysis can't predict the future. However, it does help to bring into focus a number of potential future outcomes in any trading market. Right now, many watchers are drawn to the view that the major market indices are "bottoming". That brings us to the "Bearish Rectangle Continuation Pattern". This pattern occurs when an asset has a steep decline and then stabilizes in a range, as selling pressure wanes and comes into relative equilibrium with the buying of bottom fishers, who either can't believe the market can go any lower or who are simply, and correctly, recognizing that the particular down wave is over done, and as such a bounce is at hand. After trading sideways in a range, the price will "breakdown" from the bottom of the consolidation range, and continue lower for another leg down.
So? What's the big deal? The problem is that a pattern always appears to be a bottom, because the lows hold for a number of retests. This could be what we are facing right now. This becomes more likely because prior to the current sideways range, we had a massive down move. These are called continuation patterns because after consolidating sideways in a rectangle range, prices continue in the direction they were moving before entering that consolidation phase...
We shall see!
Source:
Stockcharts.com Chart School
Rectangle Continuation Patterns
November 13, 2008
http://stockcharts.com/school/doku.php?id=chart_school:chart_analysis:chart_patterns:rectangle_continuati
DayTradeTeam
Rectangle Continuation Pattern
November 13, 2008
http://www.daytradeteam.com/dtt/day-trading-strategy/2006/07/tip-rectangle-continuation-pattern.html
Wednesday, November 12, 2008

Monday, November 03, 2008
Remarks of MSRB Chair

Source:
Remarks of Ronald A. Stack
MSRB Chair
SIFMA Annual Meeting
October 28, 2008
http://www.msrb.org/msrb1/press/Release/Remarks-RonaldAStack.pdf
Saturday, November 01, 2008

Subscribe to:
Posts (Atom)