

Saturday, December 27, 2008
Saturday, December 20, 2008

Sunday, December 07, 2008

Saturday, November 29, 2008

Sunday, November 23, 2008


Thursday, November 13, 2008

Rectangle Continuation Pattern
Bearish Rectangle Continuation Pattern
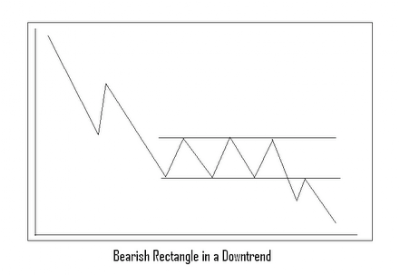

Of course, Technical Analysis can't predict the future. However, it does help to bring into focus a number of potential future outcomes in any trading market. Right now, many watchers are drawn to the view that the major market indices are "bottoming". That brings us to the "Bearish Rectangle Continuation Pattern". This pattern occurs when an asset has a steep decline and then stabilizes in a range, as selling pressure wanes and comes into relative equilibrium with the buying of bottom fishers, who either can't believe the market can go any lower or who are simply, and correctly, recognizing that the particular down wave is over done, and as such a bounce is at hand. After trading sideways in a range, the price will "breakdown" from the bottom of the consolidation range, and continue lower for another leg down.
So? What's the big deal? The problem is that a pattern always appears to be a bottom, because the lows hold for a number of retests. This could be what we are facing right now. This becomes more likely because prior to the current sideways range, we had a massive down move. These are called continuation patterns because after consolidating sideways in a rectangle range, prices continue in the direction they were moving before entering that consolidation phase...
We shall see!
Source:
Stockcharts.com Chart School
Rectangle Continuation Patterns
November 13, 2008
http://stockcharts.com/school/doku.php?id=chart_school:chart_analysis:chart_patterns:rectangle_continuati
DayTradeTeam
Rectangle Continuation Pattern
November 13, 2008
http://www.daytradeteam.com/dtt/day-trading-strategy/2006/07/tip-rectangle-continuation-pattern.html
Wednesday, November 12, 2008

Monday, November 03, 2008
Remarks of MSRB Chair

Source:
Remarks of Ronald A. Stack
MSRB Chair
SIFMA Annual Meeting
October 28, 2008
http://www.msrb.org/msrb1/press/Release/Remarks-RonaldAStack.pdf
Saturday, November 01, 2008

Saturday, October 25, 2008
Counterparty Risk Management Policy Group II

Cover Letter Addressed to Hank Paulson

SOURCE:
Counter-Party Risk
Management Policy Group II
Report, July 2005
http://www.crmpolicygroup.org/crmpg2/docs/CRMPG-II.pdf


Wednesday, October 22, 2008
Energy Information Agency - Natural Gas
Natural Gas Stores

Well, the information is out there... Looks like we are heading into that part of the year during which inventories begin to fall...
This week's report will be out tomorrow morning. On a side note, damn it's ugly out there! I mean Goldcorp (GG) under $17 bucks? Platinum in the $800's... As Joey Lawrence once said, "Whoa!"
SOURCE:
Energy Information Agency (EIA)
Weekly Natural Gas Report
http://www.eia.doe.gov/oil_gas/natural_gas/ngs/ngs.html
October 16, 2008
Tuesday, October 21, 2008
Mortgage Bankers' Assoc. - Weekly
I was going through the Economic Calendar for tomorrow. I went to The Mortgage Bankers Association (MBA) website and began poking around the place. I found the most recent report. Then I went back to November 2004, and checked out that information...
Two quick observations I find interesting:
2004 - % of total loans that are ARM's ~35%
2008 - % of total loans that are ARM's ~3%
2008 - One Year ARM = ~6.6%
2008 - 30 Year Fixed = ~6.5%
Mortgage Applications Report - November 2004

Mortgage Applications Report - October 2008

SOURCE:
Mortgage Bankers Association (MBA)
Weekly Applications Survey
http://www.mortgagebankers.org/NewsandMedia/PressCenter/65784.htm
October 15, 2008
November 10, 2004
Sunday, October 12, 2008


Thursday, October 09, 2008


Monday, October 06, 2008

Sunday, October 05, 2008


Friday, October 03, 2008


Sunday, September 28, 2008


Wednesday, September 24, 2008

Monday, September 22, 2008


Wednesday, September 17, 2008
$SILVER - Spot Silver
SILVER

I whipped up this chart two days ago, just in time to go long 1000 SLV on Monday afternoon. Let's just say it appeared we were in for an oversold bounce, although what we got today in the precious metals was breathtaking...

I whipped up this chart two days ago, just in time to go long 1000 SLV on Monday afternoon. Let's just say it appeared we were in for an oversold bounce, although what we got today in the precious metals was breathtaking...
Tuesday, September 09, 2008


Thursday, August 14, 2008

Tuesday, August 12, 2008

Tuesday, July 29, 2008

Sunday, July 27, 2008

Wednesday, July 16, 2008


Monday, June 23, 2008


Saturday, June 21, 2008
ED - NGG - PNR
Con Ed

ED, increased steadily from its May 2004 low, around $32 a share, while staying in a nice Uptrend that held support a number of times at the BLUE uptrend support line... Made a clear year-long DOUBLE TOP around $49 a share throughout 2007 and then proceeded to crash through uptrend support... Rebounded off that down move only yo be rebuffed by the SINGER MOVING AVERAGE BAND which provided staunch resistance...Needs to hold the $39 level...
National Grid

NGG in contrast with ED has essentially been in a steady uptrend since 2004. It acquired Northeast Utility giant Keyspan in 2007 and has held up relatively well, although the stock is in danger of breaking through the BLUE uptrend support, as its upside has been trapped by a down sloping resistance line thous forming a triangle pattern.
Pentair

PNR is a water company, so not technically a utility company but worth a look... This company has been trading in a wide range between $24 and $44 a share. Each time it has reached the far end of a range it fails to break out and retreats in the other direction... Recently failed around $39 at the top end of the range and looks poised to travel back to the BLUE DASHED MIDLINE at the very least...
Subscribe to:
Posts (Atom)