Tuesday, November 27, 2007

FDX - FedEx

MONTHLY


FDX had trended up huge since the mid 1990's, however it has formed a top wherein it was unable to crack the 120 level...due to the huge spike in OIL basically...Has now fallen below that SUPPORT line...

WEEKLY

FDX was moving sideways after the big move up in 2005, and spent 2 years between 120 and 100...Finally broke hard under the midline...Could be due for a near term bounce higher...

DAILY

FDX has been trending doen on the DAILY chart...Finally fell out of bed below the midline of the declining channel and clear out of the bottom of the green support line...Could mean further declines...Could mean a false breakout to the downside...

SHORT-TERM

FDX gapped down sharply and is trying to find a near term bottom around the 91 level...If it holds, we are good for a rally up to the bottom of the gap at least...if it fails 91 then more downside ahead...With OIL dropping I would think upside for now...

Sunday, November 25, 2007

BA - Boeing

DAILY

It looks like BA has traced a "SIAMESE HEAD AND SHOULDERS" on the DAILY chart here...The rebound to the neckline has already begun...We will see whether the price fails at the $92 level...

WEEKLY

BA has been trending steadily higher over the past three years...However, there has been a clear break below the support trendline recently...Will the dollar continue to decline? Will the overall market recover?

MONTHLY

BA broke out of a nice WEDGE/TRIANGLE in 2003 and has been enjoying a huge steady upward move...May be ending that rise as we speak...

Thursday, November 22, 2007

$HSI - Hang Seng - Hong Kong - REDUX

$HSI - Hong Kong - Hang Seng Index - Daily
11.22.07

Couldn't sustain the the vertical ramp which kicked off after the September 18th FED rate cut... Trying to find support around the 25,000 level...

10.18.07

Up in a straight line since the FED rate cut...This can't be sustained long-term...

$HSI - Hong Kong - Hang Seng Index - Weekly
11.22.07

Took off like crazy...but it was too far from the EMA band...AND WE GOT THAT PULLBACK...

10.18.07

Took off like crazy...but it is too far from the EMA band right now and needs to pull back...

$HSI - Hong Kong - Hang Seng Index - Monthly
11.22.07

Well, we got the pull back...down 15% in the last two weeks...

10.18.07

Up five times since 2003...Needs to come in a bit here...

Wednesday, November 21, 2007

The Ratings Agencies - MCO and MHP - Moody's and McGraw Hill

MCO

Down huge since the Triple Top which was completed earlier in '07, will try to find some support here near-term - although the ratings agencies will be getting alot of bad press in the coming months...

MHP

Pretty much the same story as MCO...McGraw-Hill's S+P business accounts for all of their profits...

Saturday, November 17, 2007

TOC - Thomson Corporation

DAILY

Broke out of its trading range to 47...Then pulled back into the range but found support around the mid-line around 41...

Fell out of bed this week...Made it below the red support line of the range...

WEEKLY

Has been trading in a neat rising channel over the past couple of years...Recently, fell from resistance to to support of the channel, let's see if it holds...


Fell out of the bottom of the channel...Should rebound to support turned resistance but technically, this is ugly...

MONTHLY

Looks to be topping out but should have support from the EMA band...


Big decline this week...Found support at the old breakout point around 37.50...

RUK- Reed Elsevier PLC

DAILY

Broke out of a triangle to the upside but then reversed and has broken down...Definitely negative...

WEEKLY

Trading sideways, but will need to find support at the bottom of this range...

Monday, November 12, 2007

SBUX - Starbucks

MONTHLY CHART


SBUX might have formed what I'm calling a SIAMESE HEAD AND SHOULDERS pattern...Basically, it's a HEAD and SHOULDERS pattern except that the HEAD is split into two distinct tops or a DOUBLE TOP around the $40 level...On the MONTHLY chart the price has clearly broken down below SUPPORT, however, I want to monitor SBUX because if the stock rallies near term with the markets overall countertrend rally then the body of the CANDLESTICK will have remaind abouve support with only the SHADOW descending below, as it has previously (see the LEFT SHOULDER)...It's certainly been hammered and seems to have relatively little downside remaining...

PNRA - Panera Bread

MONTHLY CHART


PNRA had advance from $2.50 to over $70 during it huge Bull move and has recently declined to the high $30 level as the consumer worries and profit takers have taken center stage and cut into those huge gains...Needless to say, no matter what there was some retracement bound to be in the cards for this name...My point on PNRA being that right now, this one is heavily oversold, and the overall market is likely due for a counter trend rally...so for some quick upside, it looks good, considering it is sitting at LONG TERM SUPPORT which is the green trendline...Plus this represents an excellent area for the placement of STOP LOSS orders to keep a tight leash on the downside if things go other than expected...

$TRAN - Dow Jones Transports Index

DAILY

$TRAN failed to remount the midline and fell out of the SYMMETRICAL TRIANGLE to the downside...However,there remains support at the August lows and in general, the Index is oversold in the near term.

WEEKLY

Holding long term support here at the green uptrend line...Could foretell near term bounce...

MONTHLY

If you look at the MONTHLY chart...The $TRAN has broken through support which exited the triangle and has held for a long time now...

Sunday, November 11, 2007

$NIKK - Nikkei 225

WEEKLY CHART

Off big after the worldwide drop in August but had rebounded with a counter-trend rally that failed at SUPPORT TURNED RESISTANCE...As of today's trading, the Index had fallen below the August lows on a stronger YEN against the USD...Just as a note, 14,500-ish is the 50% fib retracement of the previous 05/06 rally...

***UPDATE*** - 01.14.08 - $NIKK FALLS BELOW 14,000

Saturday, November 10, 2007

S- SPRINT NEXTEL


As far as the SHORT TERM chart goes S has been trending down below the dashed mid-line, and is now trying to find SUPPORT around the $16 level, which looks like tentative support on the other charts...


Broke out of the triangle pattern to the down side and then failed in its counter-trend rally at SUPPORT TURNED RESISTANCE...Entrenched below the SINGER EMA BAND but is looking for support here after a hearty decline...


Looks pretty oversold here as it finds itself at levels not seen since last August...What I saying is that the degree to which the price is below the EMA band implies the potential of some sort of rally here...


Broke out of a long term triangle after it's partial recovery from the huge drop it took from it's 1999 highs...Been trading in a ten point range for quite some time now and is currently at the low end of the range...If it holds it should be good for some points to the upside here...REALLY BEEN UNDERPERFORMING IN TELECOM...

Thursday, November 08, 2007

ESLR - Evergreen Solar - Now and Then

ESLR November 8


ESLR has run up huge over the past week or so, with ENERGY prices reaching lofty heights, climaxed near term today with the entire SOLAR sector popping big on FSLR's earnings numbers...Absolutely exploded out of it's long term triangle consolidation pattern...


ESLR September 27


ESLR has been forming this very long triangle pattern and has found support time and time again around the $9 level...The alternative energy space has been out of favor recently but could pop with the spiking of ENERGY prices and a change in sentiment...

NDAQ - Nasdaq Stock Market - A Chart History


Well, NDAQ finally broke out of the crystal clear two year long symmetrical triangle consolidation after it's huge move up from a $5 Pink Sheet stock to a $45 listed juggernaut...As we will see from the chart below - It broke out and shot up from $31 to $50 in 2 months or so, but retreated after making a big move on it's acquisition of the Philadelphia Stock Exchange.


This chart was screaming at me during the summer and was one of the names I liked as a Long when the market was tanking hard in mid-August before the FED rescue... Another example of how certain chart patterns can be used to predict price movements with a high percentage of success...There is nothing better than negative sentiment for long periods and frustration to propel a stock higher...


This was probably one of my first charts...I came upon this one because a law school colleague of mine was working at a company that had been taken over by NASDAQ and the company was about to be listed on the Nasdaq Exchange as it was previously only on the Pink Sheets...Let's just say it broke out!!!

$XAX - AMEX Index


Well the $XAX has significantly out performed the other Major U.S. Indices over the past 5 years. After moving sideways for some time, the Index broke out of a triangle and has trended steadily upward . The "reason" for the huge outperformance is the degree to which this Index is comprised of securities of Mining and Energy companies...Another example of how "off the radar" is the path to success...

Tuesday, November 06, 2007

$GOLD - Spot Gold - Daily

DAILY CHART - $GOLD


TRUE PRICE OF GOLD - Inflation Adjusted


The only thing that I'll say right now about GOLD is that the alleged inflation adjusted all-time high of the yellow metal is around $2200...Consolidated in a tight range for a number of months and then eclipsed the MAY 2006 highs around 730...Up GIGANTIC since the FED / Other Central banks blinked by flooding the system with liquidity after the onset of the "credit crunch" in mid- August...

SOURCES:

http://goldprice.org/inflation-adjusted-gold-price.html
http://www.stockcharts.com

Friday, November 02, 2007

SGMS - Scientific Games

MONTHLY


This was the time horizon that initially led me to take a look at SGMS as possible short -- it was up huge since 2003 and appeared to be making a TRIPLE TOP the chart showed an inability to make a new high over a period of more than a year and momentum from the long trek up was waning, although the price was still sitting on top of the SINGER ENERGY EMA BAND -- when a long up move like this one begins to reverse it will usually be a slow process although eventually the stock could upon breakdown retrace down to the top of the previously established price channel.

WEEKLY


SGMS has failed to take out the APRIL 2006 high at around 40...It appears that the previous attempt at a break out was a full retracement of the previous decline and that another leg down is possible now with support looming at the green upward sloping trendline... I was generally uninspired with the firms recent SEC filings and look for a possible miss in their earnings estimates to be released on NOV 1 2007. Among other things this company makes the computerized betting systems used at NASSAU OTB and has many lottery contracts. Analysts are expecting 28 cents a share in earnings this quarter.


DAILY


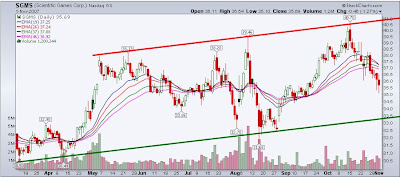
Support at around 33.50 -- also, the ENERGY BAND is beginning to slope downwards, which usually means a further decline a counter trend rally then a resumption of the decline once price is trapped below the band...

SHORT TERM


On the SHORT TERM CHART we see that SGMS has pulled back after failing at its last attempt at taking out the APR 2006 highs around 40 dollars. It is trending downwards below the ENERGY BAND and most recently is trying to find support around the 35 dollar level before its earnings release...

***UPDATE*** -- SGMS misses earnings badly and stock drops five percent...Some analysts have downgraded while others remain constructive -- See Yahoo! Article