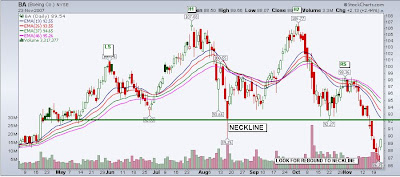
It looks like BA has traced a "SIAMESE HEAD AND SHOULDERS" on the DAILY chart here...The rebound to the neckline has already begun...We will see whether the price fails at the $92 level...
WEEKLY

BA has been trending steadily higher over the past three years...However, there has been a clear break below the support trendline recently...Will the dollar continue to decline? Will the overall market recover?
MONTHLY

BA broke out of a nice WEDGE/TRIANGLE in 2003 and has been enjoying a huge steady upward move...May be ending that rise as we speak...

No comments:
Post a Comment