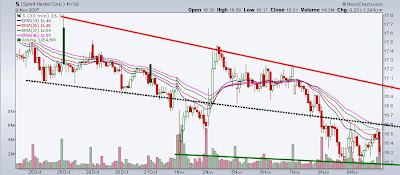
As far as the SHORT TERM chart goes S has been trending down below the dashed mid-line, and is now trying to find SUPPORT around the $16 level, which looks like tentative support on the other charts...

Broke out of the triangle pattern to the down side and then failed in its counter-trend rally at SUPPORT TURNED RESISTANCE...Entrenched below the SINGER EMA BAND but is looking for support here after a hearty decline...

Looks pretty oversold here as it finds itself at levels not seen since last August...What I saying is that the degree to which the price is below the EMA band implies the potential of some sort of rally here...

Broke out of a long term triangle after it's partial recovery from the huge drop it took from it's 1999 highs...Been trading in a ten point range for quite some time now and is currently at the low end of the range...If it holds it should be good for some points to the upside here...REALLY BEEN UNDERPERFORMING IN TELECOM...

No comments:
Post a Comment