Wednesday, December 19, 2007

DRI - Darden Restaurants

WEEKLY


Looks like DRI has support around 34, and secondarily around $28.50...

MONTHLY


DRI has been riding support trend line all the way up from 5 to 45 over the past decade...Looks dangerously close to crashing through resistance as it is clearly losing momentum...

***UPDATE*** DRI CRASHES

Monday, December 17, 2007

$VIX - Volatility Index

DAILY


Forming a triangle on the DAILY chart the $VIX just passed over the dashed center line and is perched atop the SINGER EMA BAND...Will try to break out of the triangle with continued downside in the market...

Saturday, December 08, 2007

PHG - Philips

MONTHLY (1)

MONTHLY (2)

WEEKLY

DAILY

30 MINUTE


REFERENCES:
PHG buys GENLYTE
TWO RECENT UPGRADES FOR PHG

SOURCES:

http://finance.yahoo.com/q?s=phg
http://www.philips.com
http://www.stockcharts.com

Thursday, December 06, 2007

$USD - US Dollar Index - Daily


The US DOLLAR finally stopped going down...At least for now we are experiencing a bounce which should take us back to SUPPORT TURNED RESISTENCE at the green trend line...Other Central Banks, namely England and Canada, have lowered rates recently thus dampening the relative unattractiveness of the USD.

$WTIC - Crude Oil


CRUDE OIL made a near term double top on the DAILY chart recently after failing at the $100 level...Morbidly overbought but has pulled back nicely to first support level...Can't help but think the recent news out of the NIE has helped ease the IRAN PREMIUM...

MONTHLY

CRUDE OIL on a long term basis is still firmly in an UPTREND could pull back to the midline here a still be well wihin itself...

$GOLD - Spot Gold - Weekly


SPOT GOLD was entrenched in a well defined triangle for a 15 month plus consolidation...Broke out from the 61.8% FIB line to the upside and popped $150 as its next upleg took shape...Support at $775 holding up for now...

Wednesday, December 05, 2007

Bruce Kovner on Technical Analysis

INSIGHTFUL QUOTES on Technical Analysis by BRUCE KOVNER of CAXTON ASSOCIATES...


Q: Is the generalization of that example that when an important fundamental development occurs, the initial direction of the market move is often a good tip off of the longer term trend?

A: Exactly. The market usually leads because there are people who know more than you do. For example, the Soviet union is a very good trader.

Q: In which markets?

A: In currencies, and in grains to some degree.

My point is that there are thousands of difficult to understand mechanisms that lead the market, which come into play before the news reaches some poor trader sitting at his desk. But one thing that does hit the market is a huge sale or purchase.

Technical analysis, I think has a great deal that is right and a great deal that is mumbo jumbo.

There is a great deal of hype attached to technical analysis by some technicians who claim that it does predict the future. Technical analysis tracks the past, it does not predict the future. You have to use your own intelligence to draw conclusions about what the past activity of some traders may say about the future activity of other traders.

For me technical analysis is like a thermometer.

Fundamentalists who say they are not going to pay any attention to the charts are like a doctor who says he’s not going to take a patient’s temperature. But of course that would be sheer folly. If you are a responsible participant in the market, you always want to know where the market is- whether it is hot and excitable, or cold and stagnant. You want to know everything you can about the market to give you an edge.

Technical analysis reflects the vote of the entire marketplace and, therefore, does pick up unusual behavior. By definition, anything that creates a new chart pattern is something unusual. It is very important for me to study the details of price action to see if I can observe something about how everyone is voting.

Studying the charts is absolutely crucial and alerts me to potential disequilibria and potential changes


Source:

Jack Schwager, Market Wizards, pp. 61-63

Tuesday, November 27, 2007

FDX - FedEx

MONTHLY


FDX had trended up huge since the mid 1990's, however it has formed a top wherein it was unable to crack the 120 level...due to the huge spike in OIL basically...Has now fallen below that SUPPORT line...

WEEKLY

FDX was moving sideways after the big move up in 2005, and spent 2 years between 120 and 100...Finally broke hard under the midline...Could be due for a near term bounce higher...

DAILY

FDX has been trending doen on the DAILY chart...Finally fell out of bed below the midline of the declining channel and clear out of the bottom of the green support line...Could mean further declines...Could mean a false breakout to the downside...

SHORT-TERM

FDX gapped down sharply and is trying to find a near term bottom around the 91 level...If it holds, we are good for a rally up to the bottom of the gap at least...if it fails 91 then more downside ahead...With OIL dropping I would think upside for now...

Sunday, November 25, 2007

BA - Boeing

DAILY

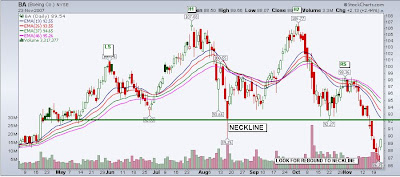
It looks like BA has traced a "SIAMESE HEAD AND SHOULDERS" on the DAILY chart here...The rebound to the neckline has already begun...We will see whether the price fails at the $92 level...

WEEKLY

BA has been trending steadily higher over the past three years...However, there has been a clear break below the support trendline recently...Will the dollar continue to decline? Will the overall market recover?

MONTHLY

BA broke out of a nice WEDGE/TRIANGLE in 2003 and has been enjoying a huge steady upward move...May be ending that rise as we speak...

Thursday, November 22, 2007

$HSI - Hang Seng - Hong Kong - REDUX

$HSI - Hong Kong - Hang Seng Index - Daily
11.22.07

Couldn't sustain the the vertical ramp which kicked off after the September 18th FED rate cut... Trying to find support around the 25,000 level...

10.18.07

Up in a straight line since the FED rate cut...This can't be sustained long-term...

$HSI - Hong Kong - Hang Seng Index - Weekly
11.22.07

Took off like crazy...but it was too far from the EMA band...AND WE GOT THAT PULLBACK...

10.18.07

Took off like crazy...but it is too far from the EMA band right now and needs to pull back...

$HSI - Hong Kong - Hang Seng Index - Monthly
11.22.07

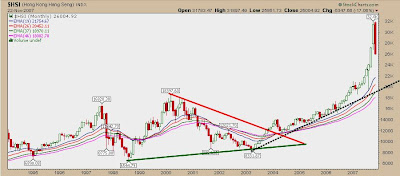
Well, we got the pull back...down 15% in the last two weeks...

10.18.07

Up five times since 2003...Needs to come in a bit here...

Wednesday, November 21, 2007

The Ratings Agencies - MCO and MHP - Moody's and McGraw Hill

MCO

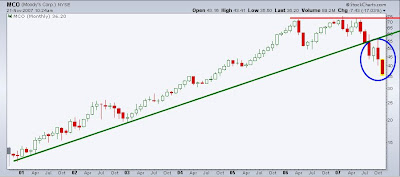
Down huge since the Triple Top which was completed earlier in '07, will try to find some support here near-term - although the ratings agencies will be getting alot of bad press in the coming months...

MHP

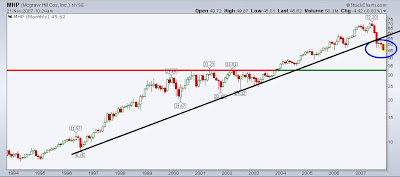
Pretty much the same story as MCO...McGraw-Hill's S+P business accounts for all of their profits...

Saturday, November 17, 2007

TOC - Thomson Corporation

DAILY

Broke out of its trading range to 47...Then pulled back into the range but found support around the mid-line around 41...

Fell out of bed this week...Made it below the red support line of the range...

WEEKLY

Has been trading in a neat rising channel over the past couple of years...Recently, fell from resistance to to support of the channel, let's see if it holds...


Fell out of the bottom of the channel...Should rebound to support turned resistance but technically, this is ugly...

MONTHLY

Looks to be topping out but should have support from the EMA band...


Big decline this week...Found support at the old breakout point around 37.50...

RUK- Reed Elsevier PLC

DAILY

Broke out of a triangle to the upside but then reversed and has broken down...Definitely negative...
WEEKLY

Trading sideways, but will need to find support at the bottom of this range...

Monday, November 12, 2007

SBUX - Starbucks

MONTHLY CHART


SBUX might have formed what I'm calling a SIAMESE HEAD AND SHOULDERS pattern...Basically, it's a HEAD and SHOULDERS pattern except that the HEAD is split into two distinct tops or a DOUBLE TOP around the $40 level...On the MONTHLY chart the price has clearly broken down below SUPPORT, however, I want to monitor SBUX because if the stock rallies near term with the markets overall countertrend rally then the body of the CANDLESTICK will have remaind abouve support with only the SHADOW descending below, as it has previously (see the LEFT SHOULDER)...It's certainly been hammered and seems to have relatively little downside remaining...
PNRA - Panera Bread

MONTHLY CHART


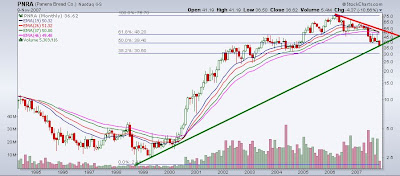
PNRA had advance from $2.50 to over $70 during it huge Bull move and has recently declined to the high $30 level as the consumer worries and profit takers have taken center stage and cut into those huge gains...Needless to say, no matter what there was some retracement bound to be in the cards for this name...My point on PNRA being that right now, this one is heavily oversold, and the overall market is likely due for a counter trend rally...so for some quick upside, it looks good, considering it is sitting at LONG TERM SUPPORT which is the green trendline...Plus this represents an excellent area for the placement of STOP LOSS orders to keep a tight leash on the downside if things go other than expected...

$TRAN - Dow Jones Transports Index

DAILY

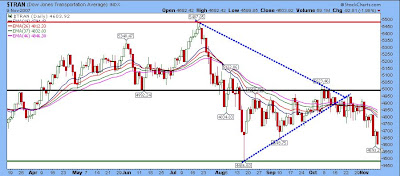
$TRAN failed to remount the midline and fell out of the SYMMETRICAL TRIANGLE to the downside...However,there remains support at the August lows and in general, the Index is oversold in the near term.

WEEKLY

Holding long term support here at the green uptrend line...Could foretell near term bounce...

MONTHLY

If you look at the MONTHLY chart...The $TRAN has broken through support which exited the triangle and has held for a long time now...